Bitcoin (BTC) Price Falls After Yearly High

The Bitcoin (BTC) price reached a new yearly high of $44,700 on December 9 but fell afterward.
The high was made above a critical long-term resistance area, but the ensuing decrease took the price below it.
Bitcoin Deviates Above Long-Term Resistance
The weekly chart for Bitcoin reveals a rapid increase in price since mid-October, marked by eight successive bullish weekly candlesticks. Last week, Bitcoin hit a new yearly high of $44,700. The high was made above a critical horizontal and Fibonacci resistance level.
Despite the weekly close above this area, the BTC price has decreased considerably this week, risking making the previous breakout a deviation.
Traders commonly employ the Relative Strength Index (RSI) as a momentum indicator to identify overbought or oversold conditions and make asset accumulation or sale decisions.
Readings above 50 and an upward trend indicate a prevailing advantage for bulls, while readings below 50 suggest the opposite. The weekly RSI is above 50 and inside overbought territory. While the indicator has fallen slightly below this week, it still trades above the 70 level, the threshold for an overbought reading.
Read More:9 Best AI Crypto Trading Bots to Maximize Your Profits
What Do Traders Say?
Cryptocurrency traders and analysts on X are bullish on the short-term BTC trend.
Credible Crypto is bullish because open interest has been wiped out in a noticeable deleveraging event. He tweeted:
For the first time in a long time, notable spot market buying here while perps are relatively flat. Perp premium also completely wiped out. Looks like spot takers are taking advantage of the dip and aggressively slurping up the discounts.
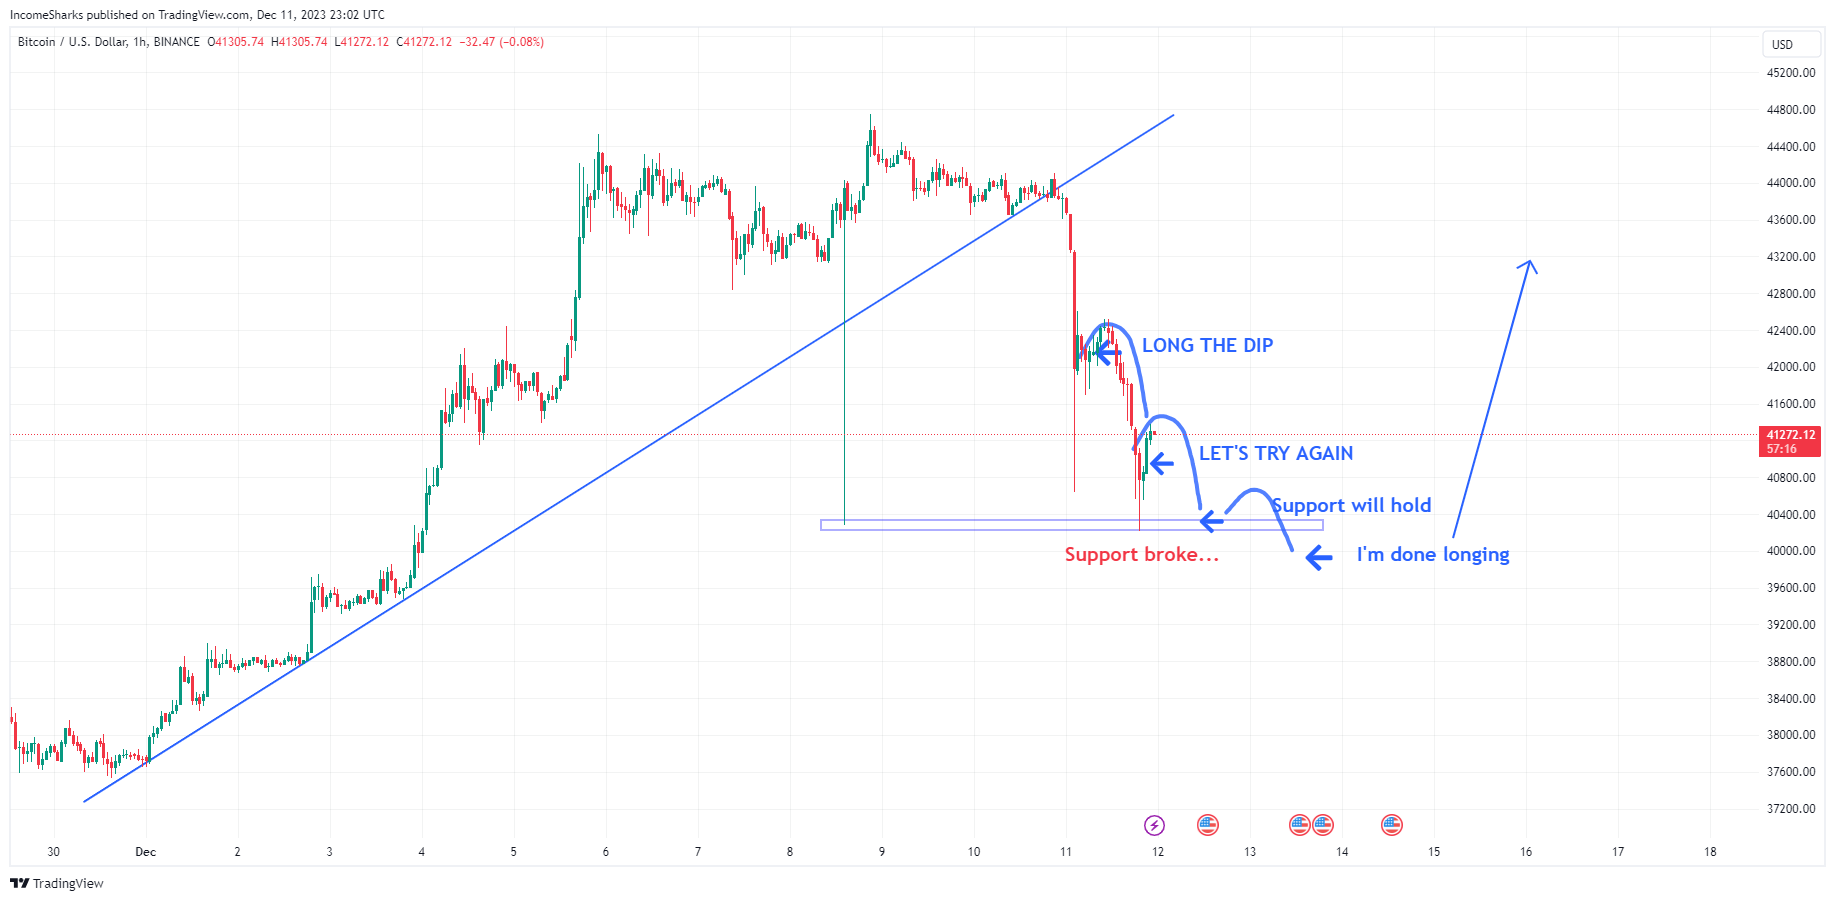
IncomeSharks believes that the price has now created a short-term range. After a deviation below the range low, he suggests that the price will begin an upward movement toward the highs.

CryptoChase has an almost identical outlook, suggesting that the upward movement will continue after the price sweeps the lows at $40,000.
Read More: Best Upcoming Airdrops in 2023
BTC Price Prediction: Is This the Beginning of the Correction?
Technical analysts utilize the Elliott Wave (EW) theory to identify recurring long-term price patterns and understand investor psychology, aiding in trend direction determination.
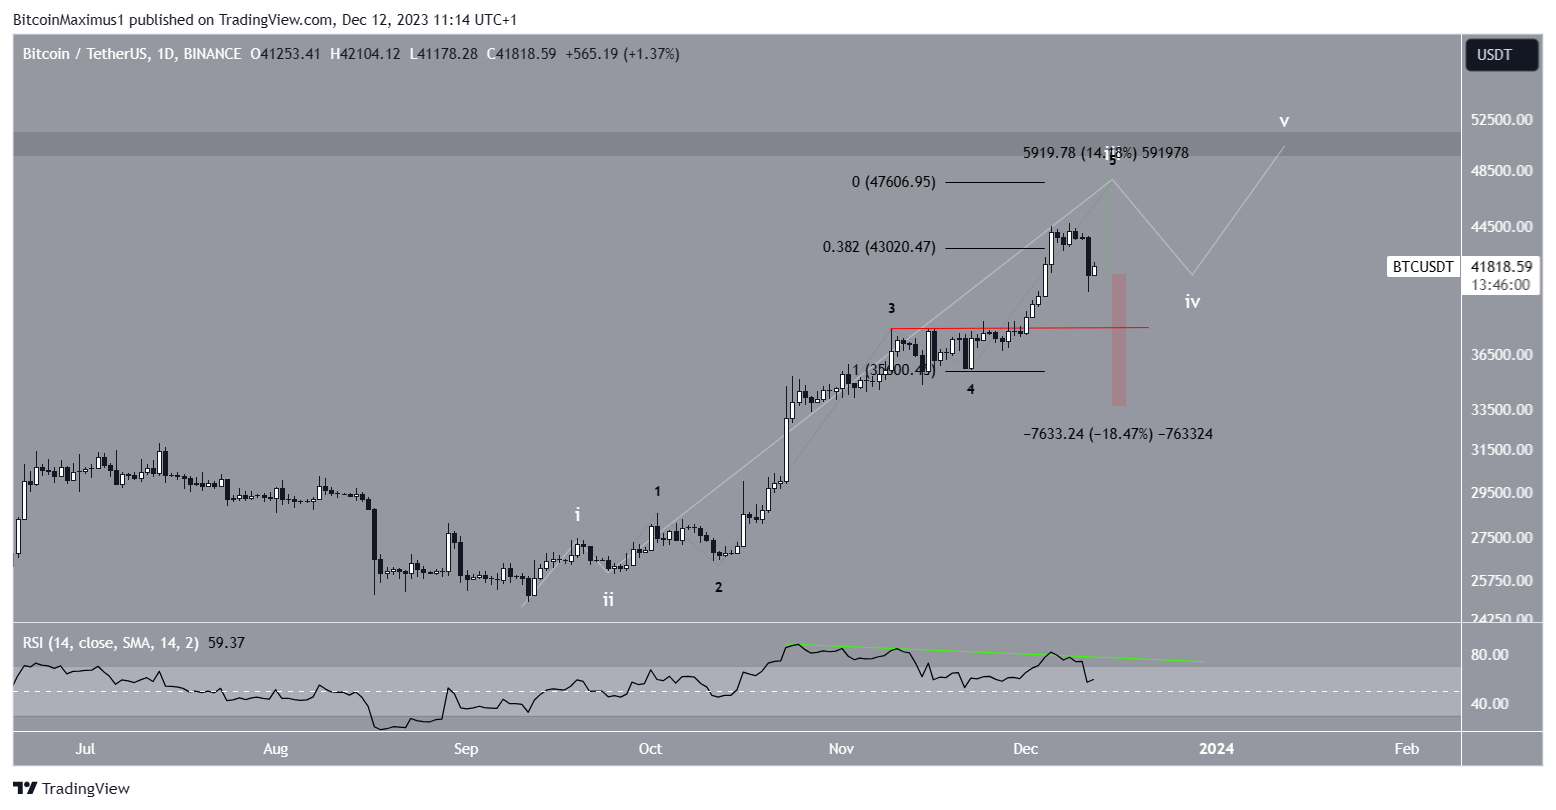
The most probable Elliott Wave count suggests that the Bitcoin price is approaching the top of wave three within a five-wave upward movement (white). Notably, wave three has extended, with sub-waves illustrated in black.
The anticipated target for the peak of wave three is $47,600, representing a 15% increase from the current price. The target length for sub-wave five is derived by combining sub-waves one and three,
Following this, Bitcoin’s price may initiate the corrective wave four. The bearish divergence (green) in the RSI indicates that the upward movement is nearing its top.

Despite the bullish BTC price prediction, a close below the breakout level (red line) at $38,000 will mean that wave four has already begun. In that case, the BTC price could fall nearly 20% to the closest support at $33,000.
For BeInCrypto’s latest crypto market analysis, click here.
Disclaimer
In line with the Trust Project guidelines, this price analysis article is for informational purposes only and should not be considered financial or investment advice. BeInCrypto is committed to accurate, unbiased reporting, but market conditions are subject to change without notice. Always conduct your own research and consult with a professional before making any financial decisions.


